Statistical functions gammainv, gammaln, geomean, growth, harmean, intercept
Excel Function GAMMAINV
The GAMMAINV() function is used to calculate the inverse of the GAMMADIST() function.
The important thing is, this function returns the inverse of cumulative distribution function.
The Syntax is as follows:
GAMMAINV(probability,alpha,beta)
| Probability | Alpha | Beta | GAMMAINV() | Formula |
| 0.3 | 3 | 1 | 1.91377579412706 | =GAMMAINV(L4,M4,N4) |
| 0.5 | 4 | 7 | 25.7044252419563 | =GAMMAINV(L5,M5,N5) |
| 0.8 | 2 | 2 | 5.98861669400424 | =GAMMAINV(L6,M6,N6) |
| 0.1 | 7 | 9 | 35.0529012438857 | =GAMMAINV(L7,M7,N7) |
Excel Function GAMMALN
The GAMMALN() function is used to calculate the natural logarithm of the gamma distribution for a given value.
The natural logarithm is the one with base value of e.
The syntax is as follows:
GAMMALN(x)
| x | GAMMALN() | Formula |
| 2 | 0 | =GAMMALN(L17) |
| 4 | 1.79175946922805 | =GAMMALN(L18) |
| 11 | 15.1044125730755 | =GAMMALN(L19) |
| 8 | 8.52516136106541 | =GAMMALN(L20) |
Excel Function GEOMEAN
The GEOMEAN() is used to calculate the geometric mean of an array of numbers.
The geometric mean is average growth rate taking into account, the compounding effect.
The syntax is as follows:
GEOMEAN(num1,num2,..num255)
| x | GEOMEAN() | Formula |
| 2 | 4 | =GEOMEAN(L27,L30) |
| 4 | 2.82842712474619 | =GEOMEAN(L27:L28) |
| 11 | 5.15101915380279 | =GEOMEAN(L27:L28,L29:L30) |
| 8 | 8.37852702443198 | =GEOMEAN(L27:L29,56) |
7.55662969711176
=GEOMEAN(L27:L31)
Excel Function GROWTH
The GROWTH() function is used to calculate the exponential growth curve for a given set of y-axis values.
This function can also take an optional set of x-axis values.
The syntax is as follows:
GROWTH(known y's,[x's],[x's_new],[optional var])
| y | GROWTH() | Formula |
| 2 | 1.89661659387997 | =GROWTH(L40:L42) |
| 4 | 2 | =GROWTH(L40:L41) |
| 11 | 8.15666374813476 | =GROWTH(L42:L44) |
| 8 | 2.3717355572556 | =GROWTH(L40:L43) |
2.0936636941679
=GROWTH(L40:L44)
Excel Function HARMEAN
The HARMEAN() function is used to calculate the harmonic mean of the given array of values.
The syntax is as follows:
HARMEAN(num1,num2,�num255)
| x | HARMEAN() | Formula |
| 2 | 3.56756756756757 | =HARMEAN(L53:L55) |
| 4 | 3.38461538461538 | =HARMEAN(L53,L55) |
| 11 | 4.14117647058823 | =HARMEAN(L53:L54,L55:L56) |
| 8 | 4.81803542673108 | =HARMEAN(L53:L56,34,L54) |
5.56682397831108
=HARMEAN(12,L53:L57)
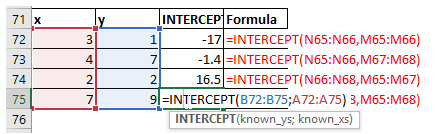
Excel Function INTERCEPT
The INTERCEPT() function is used to calculate the intercept of the linear regression for a given set of x vlues.
This is nothing but the interception of y axis.
The syntax is as follows:
INTERCEPT(x,y)
| x | y | INTERCEPT() | Formula |
| 3 | 1 | -17 | =INTERCEPT(N65:N66,M65:M66) |
| 4 | 7 | -1.4 | =INTERCEPT(N65:N66,M67:M68) |
| 2 | 2 | 16.5 | =INTERCEPT(N66:N68,M65:M67) |
| 7 | 9 | -1.53571428571429 | =INTERCEPT(N65:N68,M65:M68) |