Use 2 labels in x axis in charts in Excel
For example, for the table below, in the chart X-Axis, I want both Date and Day to be displayed.
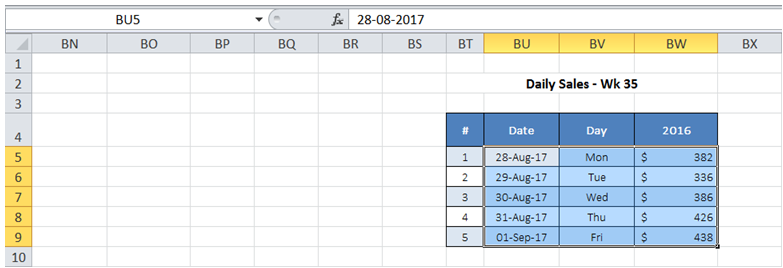
To do it in Excel, here is the answer:
a) Select the 2 columns containing the Date and Day labels as well as the column with values. Under "Insert", Click and select chart of interest (in the example below, "Line with Markers" is the option chosen).

b) Both Date and Day labels appear in the X-Axis as shown below.
Note: The columns containing the two labels need not be contiguous.

You can find similar Excel Questions and Answer hereunder
1) How do I use Find to determine last occurrence of a string in a WorkSheet range using VBA?
2) Is there a way to easily shade alternate rows in a data range for improving readability?
3) How can I hide a specific Shape in my WorkSheet?
4) How can I list all files in a folder using VBA?
5) How can I extract file name from a full path?
6) In my organization different users have different versions of Excel - how do I check compatibility issues with my WorkBook across versions?
7) How can I dynamically add series to an existing chart using VBA?
8) The name manager in Excel is very useful to keep an overview and manage all the variable names in Excel. Here how to use the name manager in VBA
9) How can I display list of NAMES in a worksheet?
10) Our financial Year is divided into 13 periods of 4 weeks each. I enter weekly YTD data. In Excel, how can I set up Worksheet to get Period data automatically?