FAQ: How to add a second Y axis on my chart?
Here an example: this shows the distance travelled and the speed of a falling object.
The distances is increasing exponentially but the speed increases constantly.
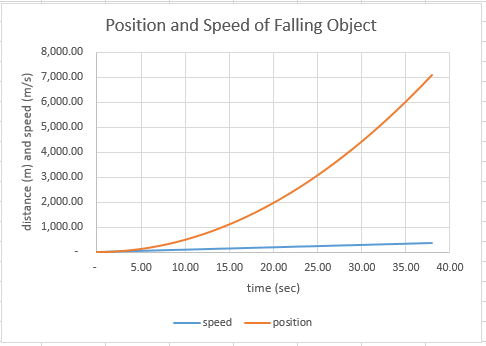
This would look much better with a second Y axis. Like this:
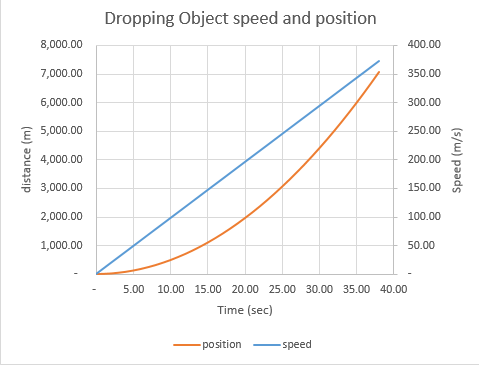
This result is achieved by:
First click on the points you want in the second axis.
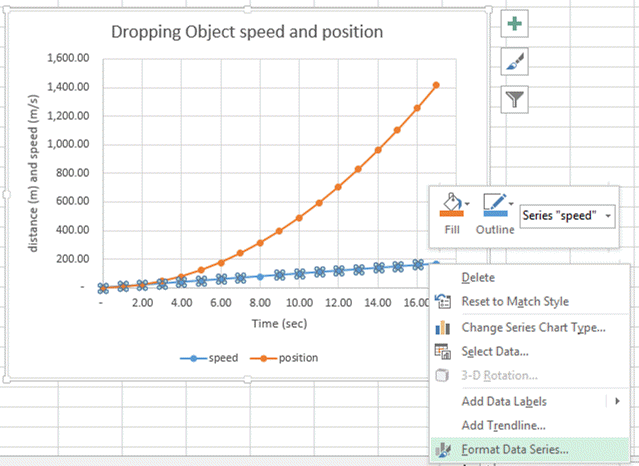
Then Select FORMAT DATA SERIES which will open the window on the side to give you the following menu. By selecting secondary axis, automatically, the series you have selected becomes the secondary axis.
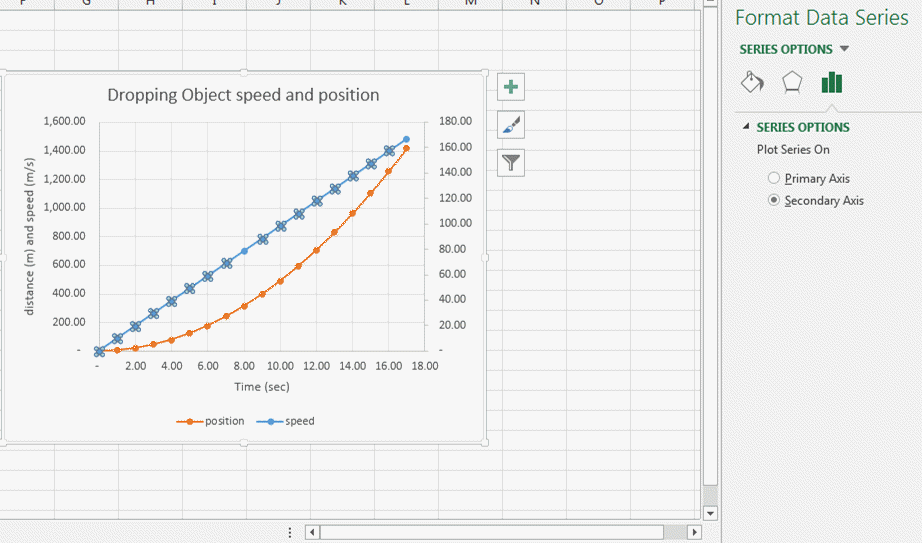
You just need to format and add titles to your axis in order to get a beautiful result.