More Complex Formulas in Excel
Lets go a bit deeper in what you can do with Excel and see
more complex function allowing us to sum columns, row or
subtotal, or finding the maximum or
minimum of a set of data, or do complex
operations like a sinus or log calculation.
If you look for all the functions listed
one by one, then go to our
function page.
Lets first use an example. We are a farmer and collect
apples and other fruits. We sell them in baskets. We want to calculate our
earnings.
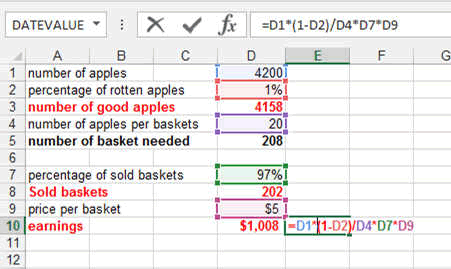
You can see that I calculated the result by multiplying and
dividing the various reference with each other. This is the Power of Excel
Spreasheets.
You can download this example here.
You could also name the various cells in
order to make this more readable. Look
here how this is done.
Sum up Columns and Rows
Look at the following table which shows every tree in our
field with the numbers of apples it produced.
We want to know how many apples it produced totally.
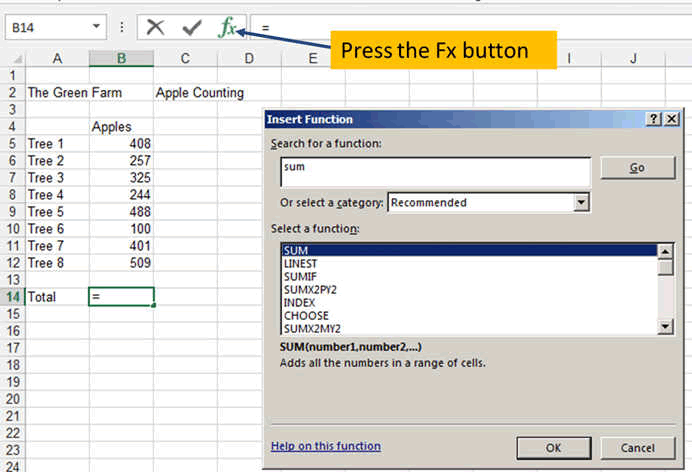
Once you have entered your numbers, go to the bottom and
press the Fx button.
The new window opening is the window allowing you to find
any function in Excel.
There is a HELP in the first line where you can enter what
you want to do. So enter SUM and press GO. It will show you the various
function related to the word SUM.
In our case, select the first one. You can of course read
the explanation each time it appears when you click on a function.
This new windows open. As you can see, it selected cells B5
to B13 and it shows you on the bottom the result. Here 2732 apples.
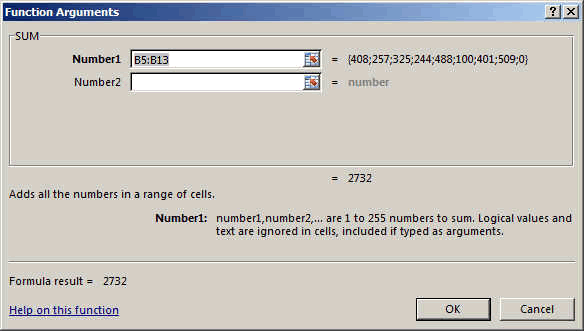
This seems pretty correct!!
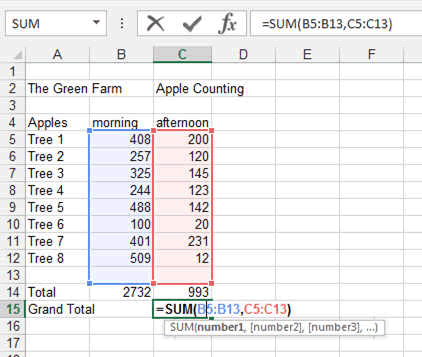
You could enter another set of numbers if you wanted in the
NUMBER2 area. For exemple if you had collected apples in the morning and
apples in the afternoon. Like here.
Which you would do by pressing the little icon on the right
of the NUMBER2 area. This would allow you to select another area.
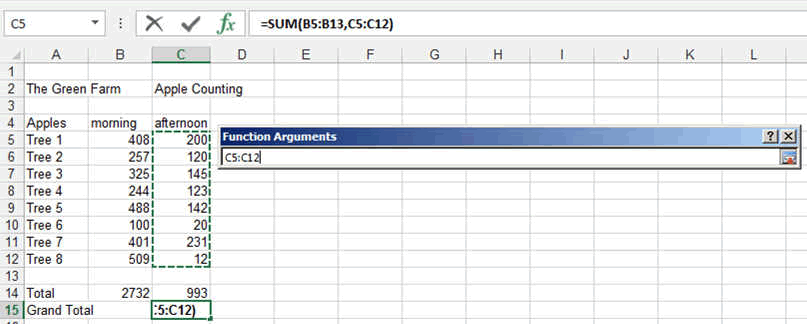
The final result would look like this.
SUM an Array
You can sum not only column or rows but full arrays like following.
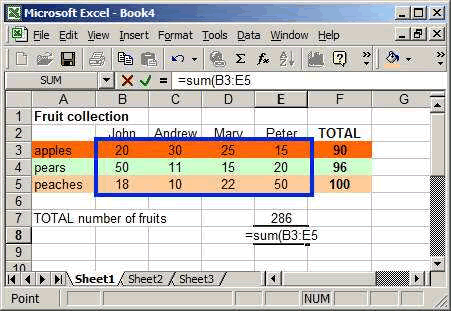
- To make the previous table, first enter the various labels (John,
..., apples, ..., Total, ...).
- Then in cell E8, type =sum(
- Automatically, Excel will recognize that you are willing to do the
sum of something and will give you control of the cursor.
- Move you cursor to the cell B3 and drag it to the cell E5.
- Then release the button and press ENTER (you can also click on the
little green tick).
- The number 286 will appear !!! which is the total number of
fruits....
Some Trigonometry
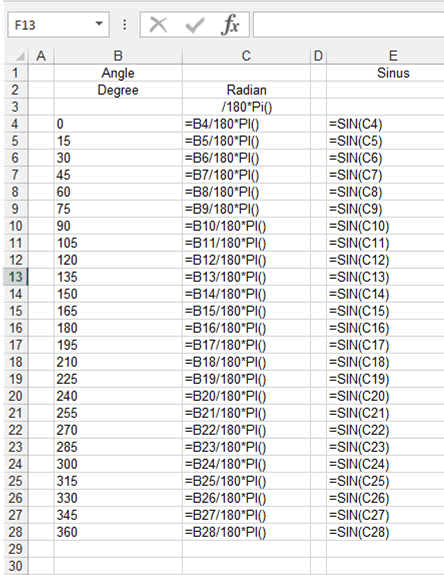
Let's calculate the Sinus of some angles.
Excel calculates its angles in RADIAN. Usually, students
start with DEGREES. The conversion factor is Degrees/180*Pi = Radian.
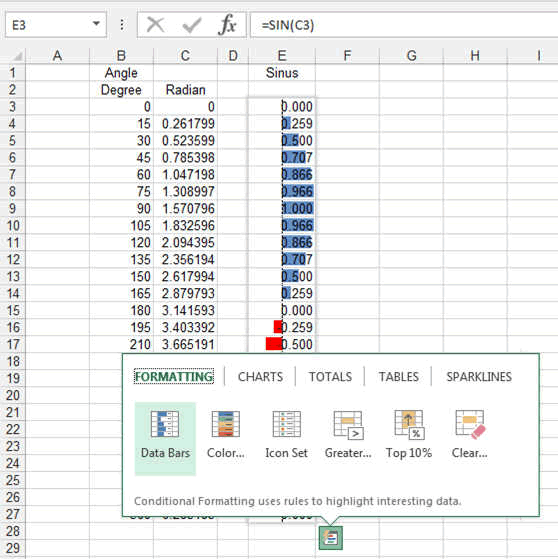
Here the exemple plus some nice curves.
Let's add the curves (we will see this in a later chapter
but Excel allows you to do this nice visual trick with the Data bars.
Finding Minimums and Maximums in Arrays
Excel can also be used to sort out data, to find "things" out of a bunch
of numbers.
Finding the maximum and the minimum is sometimes very useful. Here how.
The formula is enterered the same way as previously described. You can
select an array just a row or a column.
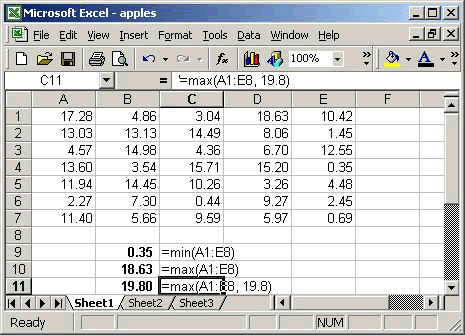
Same as per previous formulas, the references are entered as following:
To make an array, type Reference1:Reference2
To average various values, separate them with comma.
Here also you can enter other elements in between the brakets.
You can enter the array only as per '=min(A1:A8)
or you can enter '=max(A1:A8, 15) which would give you the maximum
between the biggest number in the table and 15,
or you could enter also '=max(A1:A8,sum(A1:A8)/35))
tip: avoid too big formulas, they tend to be
undreadable. Try splitting them in pieves if possible.
The subtotal function is very important as it allows you not
only to calculate the Sum of rows and columns but also the average, the
deviation, etc...Even when you filter data (you will see this in the
tables), then the subtotal will give you the result only for the visible
items.
Here what the results of SUBTOTAL give
The option for SUBTOTAL are as described in the picture
- 101 AVERAGE: average
- 102 COUNT: count the total number of numerical cells
- 103 COUNTA: count the total number of cells
- 104 MAX: maximum
- 105 MIN: minimum
- 106 PRODUCT: product of all the numbers
- 107 STDEV: standard deviation
- 108 STDEVP: standard deviation for a population
- 109 SUM: sum
- 110 VAR: variance
- 111 VARP: variance for a population (more accurate)
These were some basics. Now you will learn by doing.
Now look at the Excel top 10
formulas.