Filtering Data in Excel
Similar to Sorting, Filtering will get you the data you need
out of a big quantity of data. We will be using the Apple Farm again for our
example.
Filtering means getting the data you want and display it.
And
for the data you don't want, you don't display it.
So the main Filtering possibilities are
- equals to
-
does Not Equal to
-
is great or small than
-
is between two values
-
above average
-
below the average
-
in the top 10 values.
You can have maximum 2 filters conditions....if you want
more, look at the bottom of the page for the HOW TO....
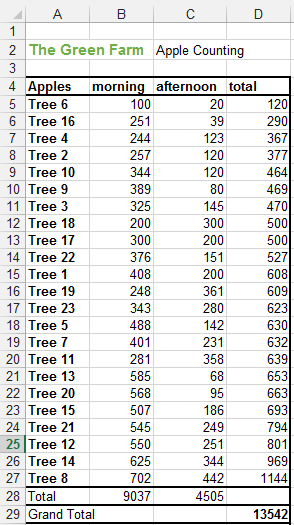
APPLE FARM
Our apple farm has grown and we have now 23 trees instead of
10 and so it is more difficult to have a good overview. So we want to sort
out our trees according to the total number of apple harvested. You can see
the graph is also not so nice anymore....
So we should now change the bottom lines Total and Grand
Total.
Originally the formula was SUM(B5:B27). The problem with the
SUM function is that it sums really every row even the ones that are not
displayed. Now by changing the formula to
=SUBTOTAL(109,B5:B27) and
=SUBTOTAL(109,C5:C27) and =SUBTOTAL(109,D5:D27) for each cell
respectively, the total displayed will be the one of the visible cells.
The SUBTOTAL function is discussed
here.
Now let's change this into a table. If you don't remember
how to do this, go quickly see the following link.
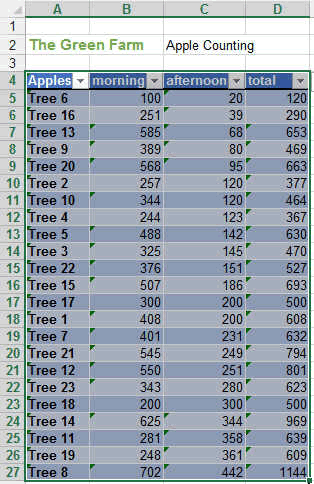
By pressing on the small inverted triangle on the right of
the headers, you will see the following menu.
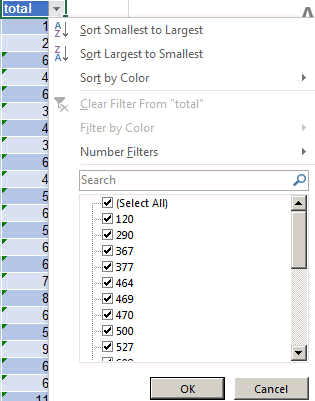
We used this already for the sorting, but now we will use
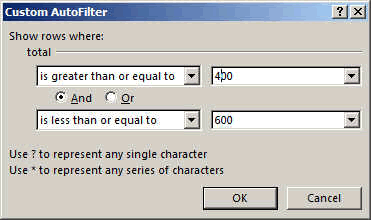
the NUMBER FILTERS. By pressing on them the following menu appears.
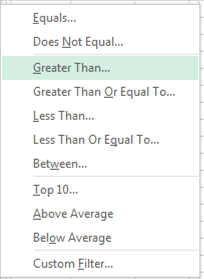
We will now filter the tree that produced between 400 and
600 apples. This is known to be a healthy tree.
The new table will look like this:
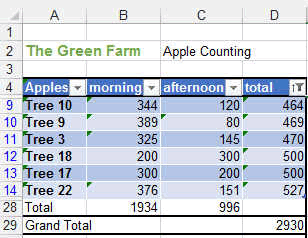
You can see the totals are also correct and are the sums of
the filtered items only.
So this is how you filter.
As said before you might want to make more complex
filtering, for example trees between 0 and 200 apples as well as trees
between 800 and 1500. So this is not possible here except with some complex
table manipulation. The best is to use conditional
formatting.
How to filter using very complex formulas?
If you need very very very complex and multi parameter
filtering, you could use the CONDITIONAL
FORMATTING first, which will highlight the data you are interested in (in
a few different colors for example), and then, using the filtering, you
could just do some color filtering.
So that's it for filtering data. We filtered it out, isn't
it (;-)...
These were only some basics. Now you will learn by doing.