Sorting Data in Excel
Sorting data is ONE of the Main functions of EXCEL. When you
have
A whole lot of data from a statistic
A customer base with sales figures
A Budget with many different positions
Any other set of bigdata
That you want to sort out, Excel will do it for you with a
bit of your help....
APPLE FARM
Our apple farm has grown and we have now 23 trees instead of
10 and so it is more difficult to have a good overview. So we want to sort
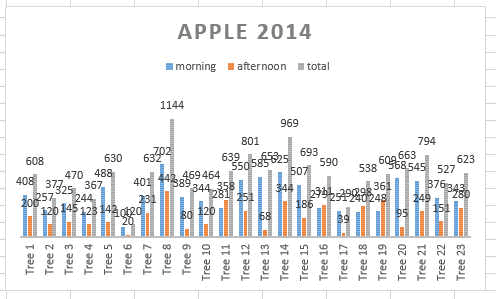
out our trees according to the total number of apple harvested. You can see
the graph is also not so nice anymore....

So there are 2 methods and I will start with the most
difficult one because it allows you also much more flexibility and gives
your more choices and options for sorting.
We will be using the SORT function in the DATA ribbon.

We must now select the area we need to sort out. So lets
select from row 5 to 27.

Now by pressing the SORT button the following windows will
open.
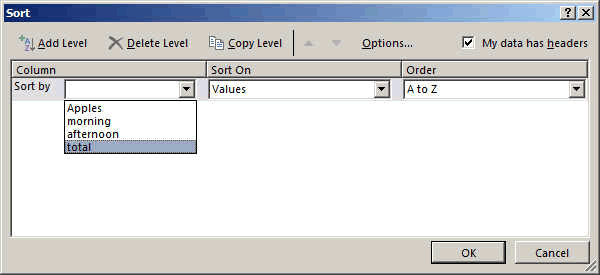
You can see it gives you the choice to sort according to
your 4 columns: apples, morning, afternoon and total number of apples.
You can sort it by Value, Cell Color, Font Color and Cell
Icon..... Isn't this great!!!
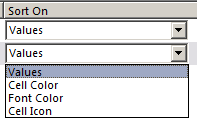
Now we will stay with Value.
But for example if you had used the conditional formating to
color the cells or had colored the cells manually, then you could do some
sorting according to the colour.
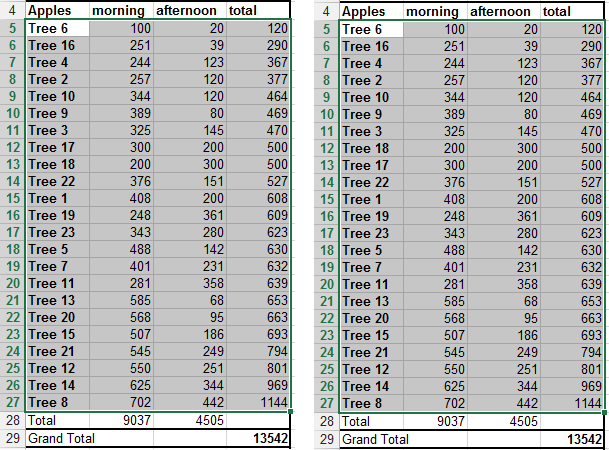
So by selecting sort TOTAL by Values, the table is sorted
the following way.

Please OBSERVE the trees 17 and 18, they
both have 500 apples. So which one should be first.
That is how we use the ADD LEVEL Function to add one more
condition that says we want to sort according to the morning harvest as a
second sorting filter.

And the result is the following. Here you can see the two
filtered results side by side. Everything is the same, except the trees 17
and 18. This was an easy example, but there might be times when you have
multiple data with exactly the same results for some parameters and you want
to separate them. That is how it is done.
About the Graph
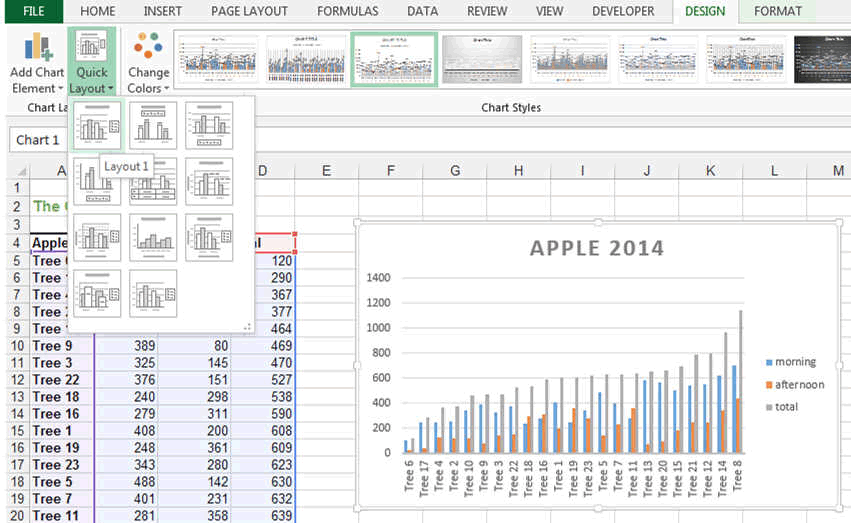
You can change the graph very easily in the quick layout
area to remove some of the data that overwhelms it.
Use of Tables
As explained in the basics, Excel gives us the possibility to create
tables easily and additionnaly lets you do some easy filtering process.
If you only look for single column filtering, that is what you have to
use. Otherwise, use the SORT function explained higher in the text.
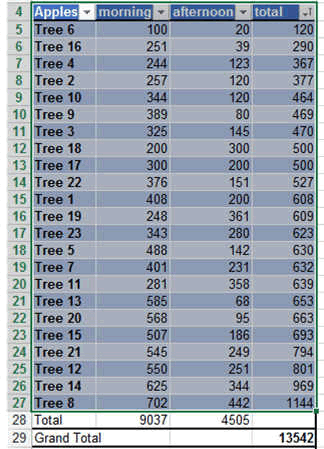
First we must create a table and to do this we must select the row
with the header to the last row with tree 23.
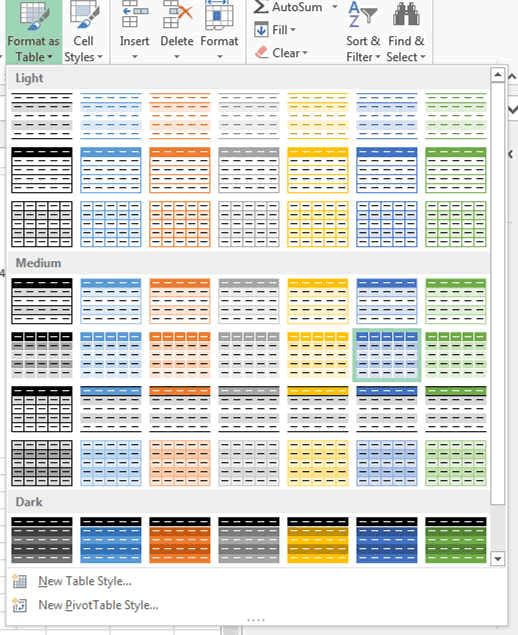
We then select the table design we want in the HOME RIBBON
Format As Table.
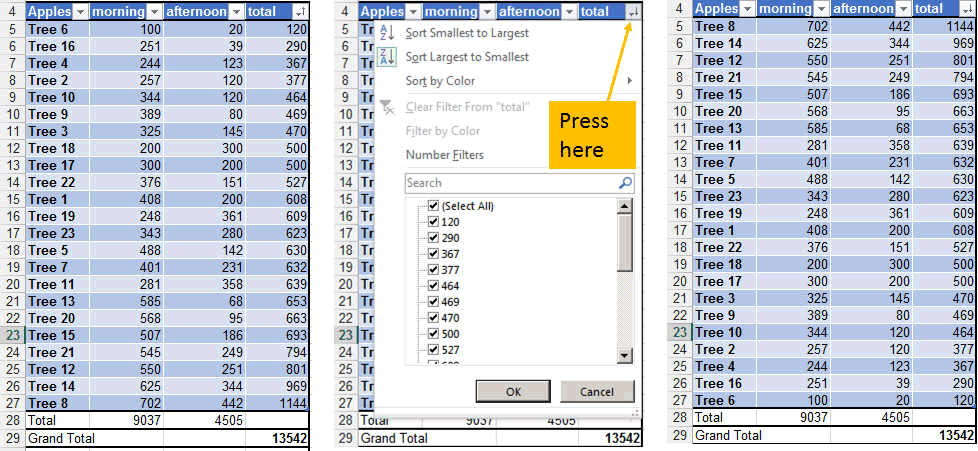
We can then easyily filter one column or the other by
selecting the column we want to filter and select the filtering type.
Here we changed from Smallest to Largest
into Largest to Smaller...
So that's it for sorting data. We sorted it out (;-)...
These were only some basics. Now you will learn by doing.


