Chart Features: Add Text, Titles, etc... to your Charts
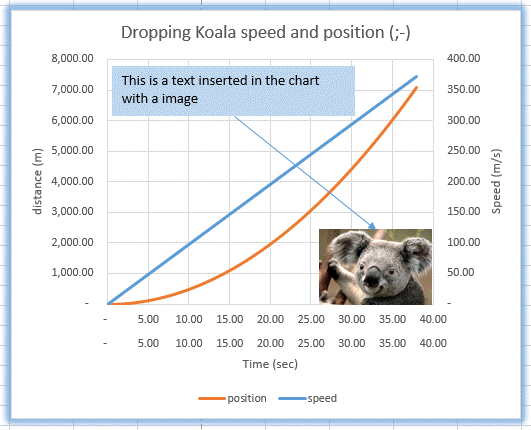
Here a graph with a few add ons.
For those who went to Australia, the drop bears are the Koalas that supposedly drop from the eucalyptus trees... So we calculated their speed.
Add LABELS to the AXES.
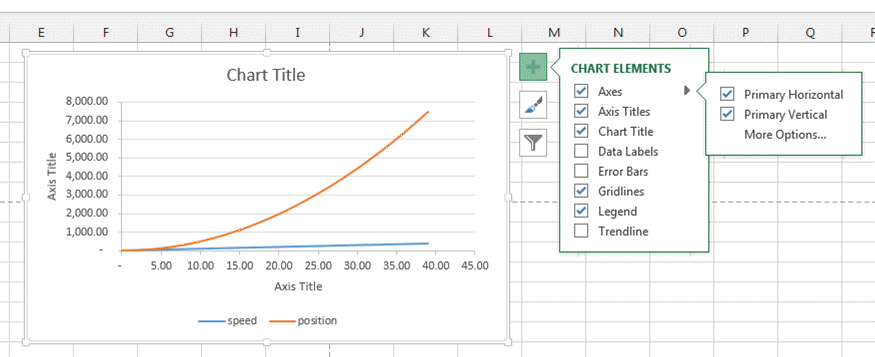
To add Labels to your graphs select the PLUS sign on the right of your graph and click on the various items you want to appear.
Once this is done, the graph will look like this.
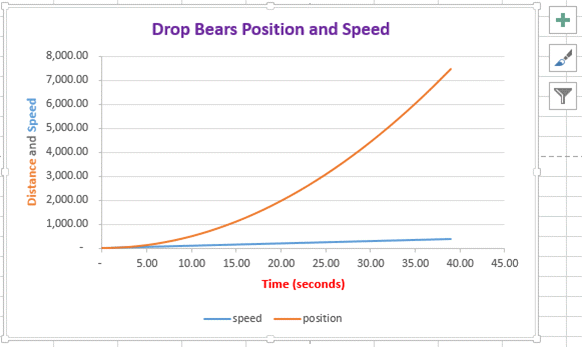
Now Double-Click on the various text boxes and type in your labels. Like for any text in Excel, you can change the font, colour, size, etc.....

Finally it gives you this.
Add Text boxes
To add a text box, click on your chart first.
Then go into the Insert Ribbon and select the insert shapes text box.
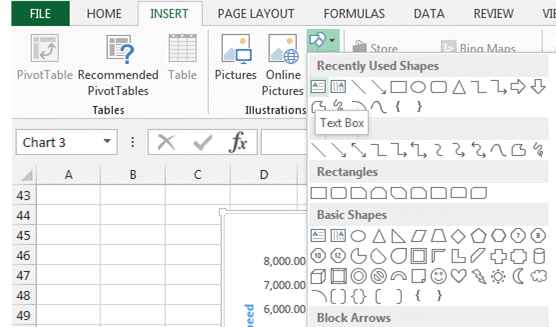
Then click and drag a text box in the chart like this.
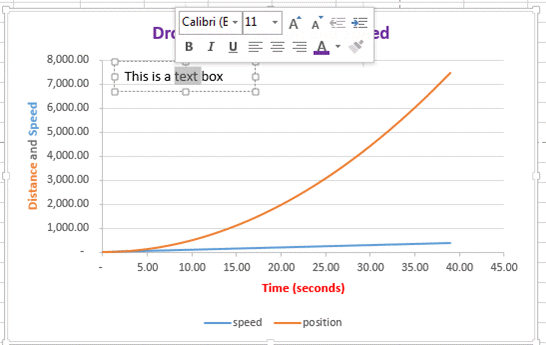
You can now enter any text and change its style to your liking.
Add a Picture
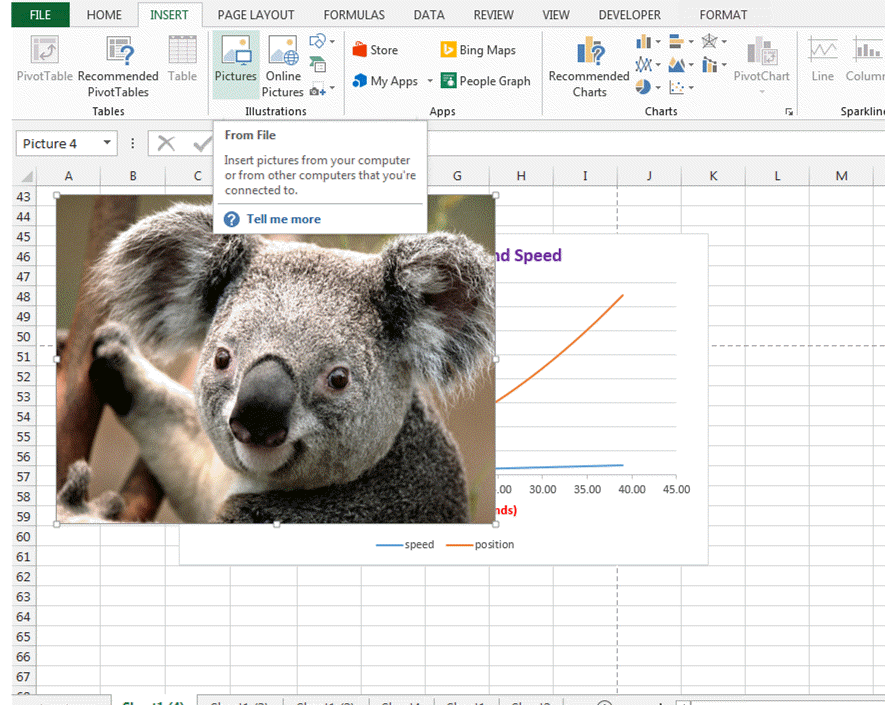
First, and this is very IMPORTANT, click outside of your chart.
Then INSERT a picture and rezise it to the size you wish.
Like here:
Here it is resized:
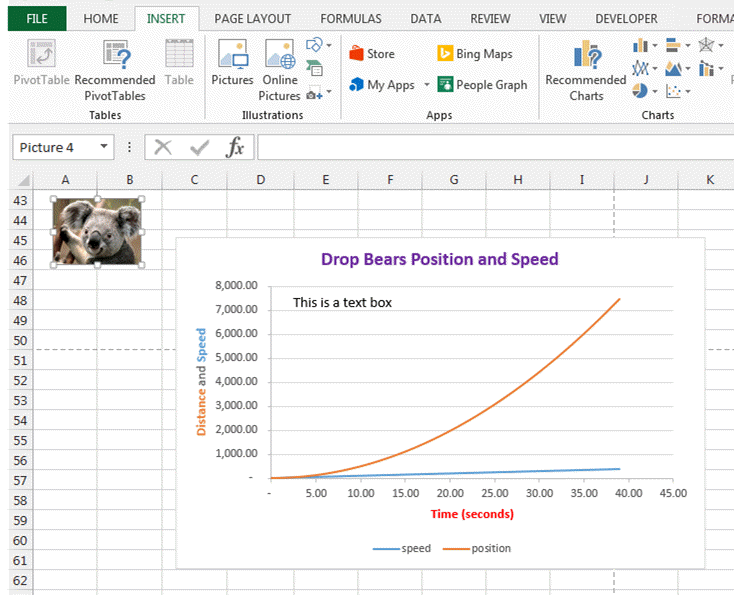
Now click on the picture and Copy it with CTRL-C or by pressing the
 button.
Click on the chart.
And PASTE the picture into it with CTRL-V or
 button.
The picture will appear on the top left corner of the graph.

You now just need to move it where you want.
You can still change it size and play effects on it.

That is it for the insertion of text, image and adding labels on charts.