The X Y Scatter graph
Scatter charts are used to find the relationship between two variables. One is on the X (horizontal) axis and one on the Y (vertical) axis.
To create a scatter chart do the following.
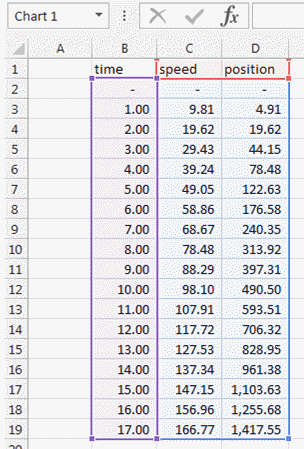
Create your table. It can be calculated values like here the speed of a object dropped in the air.
In that case the X value would be the time,
the Y value would be the speed which changes accroding to Speed = Gravity x time. (Gravity being 9.81m/s2)
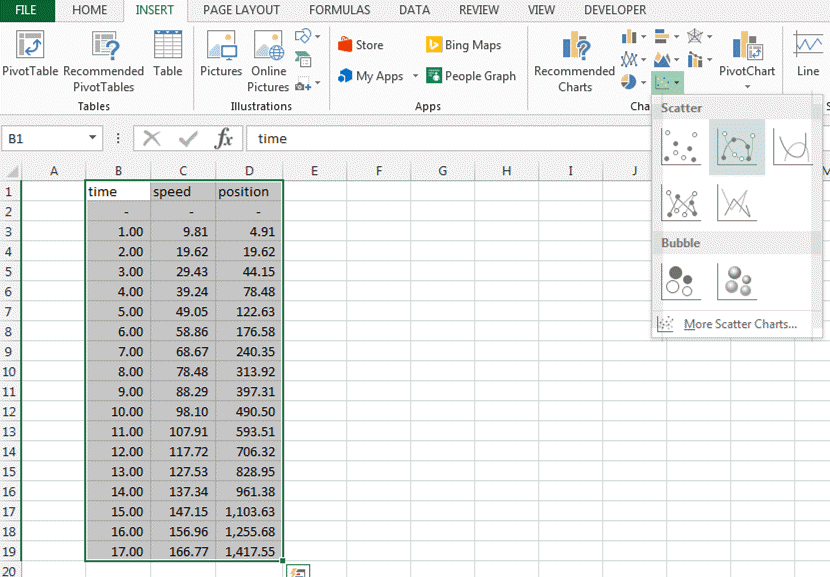
By selecting the cells and pressing the scatter menu in the insert ribbon.
You get following scatter graph.
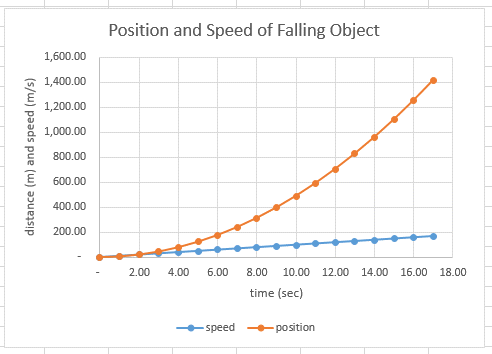
I have added the labels and a titles. How to do this is described in the graph features page.
We can make this better looking like having a second Y axis. Like here.
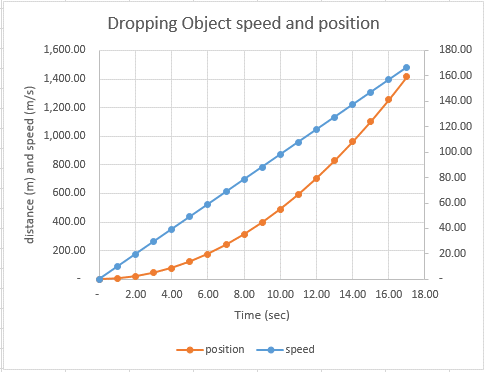
This is described in the page "how to add a second Y axis".
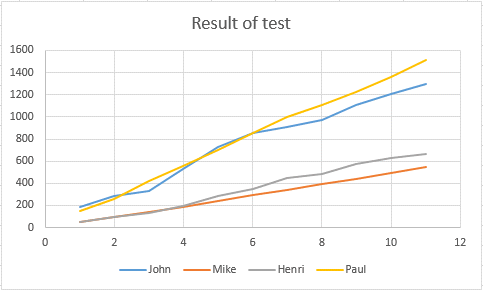
You can of course add more than 2 Y data like here with these test results.