Vba count series in chart in Excel

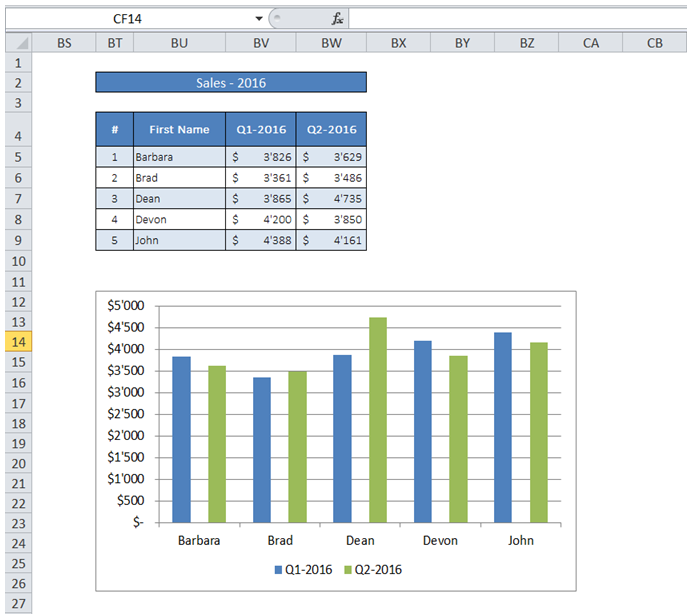
For example, I already have a chart ("Chart1") of Sales data. I want to get the number of series in Chart using VBA?

excel vba count series in chart

To do it in Excel, here is the answer:

  1. Option Explicit
  2. Sub SeriesCount()
  3. Dim lngSeriesCount As Long
  4. lngSeriesCount = ActiveSheet.ChartObjects("Chart1").Chart.SeriesCollection.Count
  5. ''
  6. End Sub

Description:

a) Line 4 - "Chart.SeriesCollection Method" is used to access the properties of the Series.


You can find similar Excel Questions and Answer hereunder

1) How do I use Find to determine last occurrence of a string in a WorkSheet range using VBA?

2) Want to use Microsoft Outlook in Excel. Here some basic explanation to get you started

3) How to read a value from a cell in vba in Excel

4) How to hide and unhide rows and columns in excel VBA

5) How to code more simply in VBA. Use of Keywords is helping a lot

6) How can I remove display of Gridlines in my worksheet using VBA?

7) How can I add Trendline to a chart using VBA?

8) How can I add a WorkSheet and name it as required using VBA?

9) How can I hide a sheet completely from users (the sheet should not even appear in Unhide dialog box)?

10) How to change desktop background in Excel


Here the previous and next chapter