Vba add legend to chart in Excel
For example, I already have a chart ("Chart1") of Sales data for Q1-2016 and Q2-2016. I want to add a Legend to the chart using VBA?

To do it in Excel, here is the answer:
- Option Explicit
- Sub AddChartLegend()
- ActiveSheet.ChartObjects("Chart1").Chart.HasLegend = True
- ActiveSheet.ChartObjects("Chart1").Chart.Legend.Position = xlBottom
- End Sub
Description:
a) Line 3 adds a Legend to chart.
b) Line 4 defines the position of chart (xlTop, xlBottom, xlLeft, xlRight, xlCorner)
c) Similarly, if Data Labels hves to be added, the command becomes, ActiveSheet.ChartObjects("Chart1").Chart.SeriesCollection(1).HasDataLabels = True (This is for Series collection 1 - for Series collection 2, the argument changes to 2).
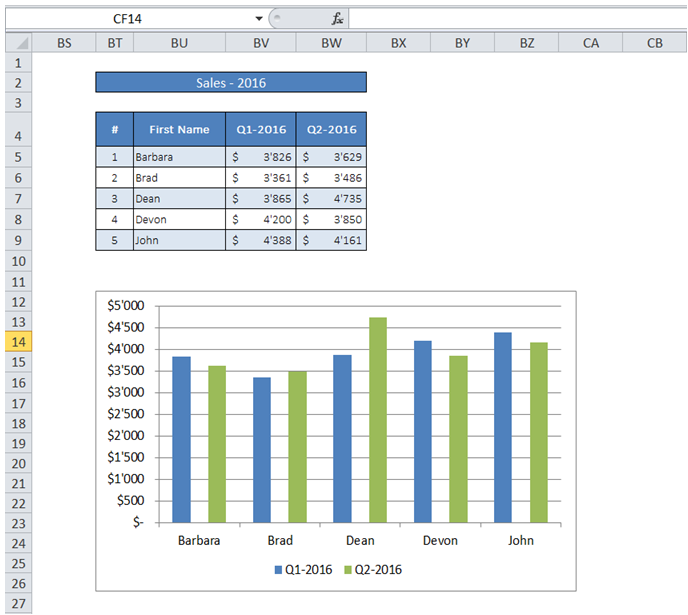
Result after Macro execution:
You can find similar Excel Questions and Answer hereunder
1) How can I get input from user through a prompt and assign user's input to a cell?
2) How can I get users to select a file for processing using my macro?
3) How can I set up ListBox using VBA to allow users to select multiple values?
4) What are the addins in the developer tab in Excel
5) How can I add a 3 Month Moving average Trend line to my line chart?
6) How to handle errors in VBA with the handling error methods
7) How can I save a WorkSheet as a new WorkBook using VBA?
8) I have a macro that takes a lot of time for execution - how can I keep the user informed that the macro is running?
9) How can I loop through all ActiveX checkboxes in WorkSheet and set them to Unchecked status?
10) How can worksheet functions be accessed in VBA?