Statistical functions countifs, expondist, forecast, frequency, gammadist
Excel Function COUNTIFS
The COUNTIFS() function is used to calculate the cell count that matches more than one criteria.
This function is similar to COUNTIF() except that, it can take more than one condition and range.
The Syntax is as follows:
COUNTIFS(range1,condition1,range2,condition2, ....)
| Range1 | Range2 | COUNTIFS() | Formula |
| Men | 100 | 2 | =COUNTIFS(L$4:L$8,"Men",M$4:M$8,">90") |
| Men | 200 | 1 | =COUNTIFS(L$4:L$8,"Men",M$4:M$8,">190") |
| Men | 20 | 0 | =COUNTIFS(L$4:L$8,"Men",M$4:M$8,"=90") |
| Men | 15 | 3 | =COUNTIFS(L$4:L$8,"Men",M$4:M$8,"<50") |
| Men | 1 | 4 | =COUNTIFS(L$4:L$8,"Men",M$4:M$8,"<>200") |
Excel Function EXPONDIST
The EXPONDIST() function returns the value of exponential distribution of a specified value.
The exponential distribution function is a continuous probability distribution function.
The syntax is as follows:
EXPONDIST(x,lambd,[cumulative or probability density function])
The third argument, if TRUE, calculates Cumulative distribution function, if FALSE, its Probability density function.
| X | Lambda | EXPONDIST() | Formula |
| 1 | 1 | 0.632120558828558 | =EXPONDIST(L17,M17,TRUE) |
| 0.8 | 2 | 0.403793035989311 | =EXPONDIST(L18,M18,FALSE) |
| 1.2 | 3 | 8.19711673418777E-02 | =EXPONDIST(L19,M19,FALSE) |
| 0.5 | 4 | 0.864664716763387 | =EXPONDIST(L20,M20,TRUE) |
| 8 | 5 | 1 | =EXPONDIST(L21,M21,TRUE) |
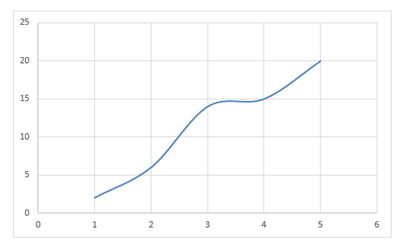
Excel Function FORECAST
The FORECAST() function is used to predict the future point value on a linear trend line.
The prediction is based on a supplied set of x and y values.
The Syntax of the function is as follows:
FORECAST(x, known_x_values,known_y_values)
| Data | Known X | Known Y | FORECAST() | Formula |
| 2 | 1 | 2 | 6.9 | =FORECAST(L31,$M$31:$M$35,$N$31:$N$35) |
| 2.5 | 2 | 6 | 9.15 | =FORECAST(L32,$M$31:$M$35,$N$31:$N$35) |
| 5 | 3 | 14 | 20.4 | =FORECAST(L33,$M$31:$M$35,$N$31:$N$35) |
| 7 | 4 | 15 | 29.4 | =FORECAST(L34,$M$31:$M$35,$N$31:$N$35) |
| 6 | 5 | 20 | 24.9 | =FORECAST(L35,$M$31:$M$35,$N$31:$N$35) |
Excel Function FREQUENCY
The FREQUENCY() function is used to calculate the number of values from a specified array matching certain criteria.
This function deals with array of values.
The syntax is as follows:
FREQUENCY(array of data_array_of_bin)
| Data | Bins | FREQUENCY() | Formula |
| 2 | 14 | 3 | =FREQUENCY(L$46:L$50,M46) |
| 11 | 11 | 2 | =FREQUENCY(L$46:L$50,M47:M48) |
| 12 | 17 | 3 | =FREQUENCY(L$46:L$50,M48) |
| 21 | 26 | 1 | =FREQUENCY(L$46:L$50,M46:M49) |
| 45 | 4 | 1 | =FREQUENCY(L$46:L$50,M50) |
Excel Function GAMMADIST
The GAMMADIST() function is used to returns gamma distribution of supplied values.
The gamma distribution is used in queuing analysis in probability analysis subject.
The syntax is as follows:
GAMMADIST(x,alpha_value,beta_value,cumulative)
The 'cumulative' is a Boolean value specifying type of distribution.
TRUE- Cumulative distribution function
FALSE-Probability density function
| x | alpha | beta | GAMMADIST() | Formula |
| 2 | 14 | 3 | 2.11091309487003E-14 | =GAMMADIST(L58,M58,N58,TRUE) |
| 13 | 11 | 2 | 2.78885802321884E-02 | =GAMMADIST(L59,M59,N59,FALSE) |
| 34 | 17 | 3 | 6.90927484704603E-02 | =GAMMADIST(L60,M60,N60,TRUE) |
| 21 | 26 | 1 | 5.55459718267936E-02 | =GAMMADIST(L61,M61,N61,FALSE) |
| 45 | 4 | 1 | 1 | =GAMMADIST(L62,M62,N62,TRUE) |