Graph a Functions or an Equation in Excel
A common question new Excel users ask is "How can I graph an
equation?" Excel allows you to draw nice curves of all the formulas you wish. If you are a student or scientist and in
order to visualize a process described by an equation, plotting the equation
is the easiest. You can see our tutorial in our graph a
function page.
In this page we show you an example template that will let you graph any functions in Excel.
Then you can move it along the axes, zoom in and zoom out of the function
You can trace any function you like, linear Function, Exponentials, Trigonometric formulas.
Plot any of these
functions by selecting them among the ones given in the example. A picture
is worth 1000 words. Same for curves and graphs. Try this spreadsheet.
The spreadsheet graph template will let you draw curves as
follow. There is a version with Macro and one without macro. You might not
like macro because of safety reasons but the macro version allows you to use
button to change the scales.
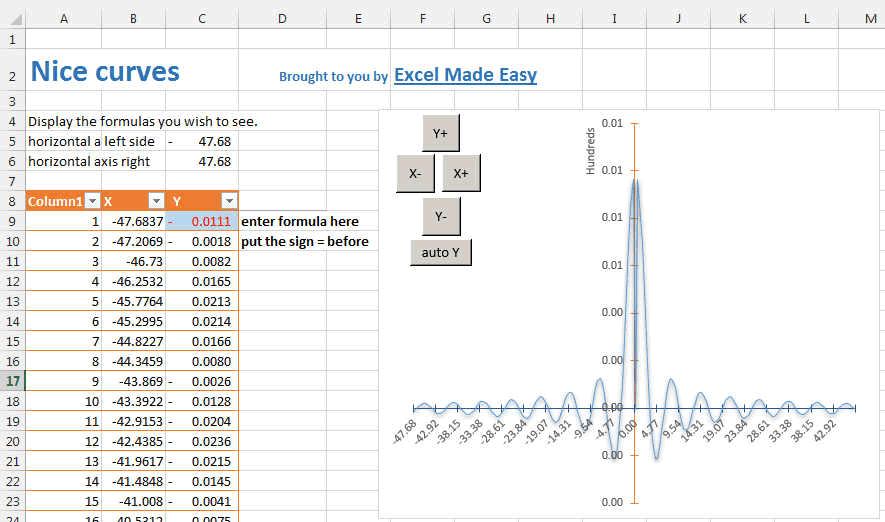
You can enter any function in a very easy way. Just enter it
in the blue cell in the x form. Like here in these examples:
- sin(x)/x
- sin(x)/abs(x)
- x*sin(1/x)
- sin(x-1)/(x-1)
- (1-sin(x))/(cos(x)*cos(x))
- x/abs(x)
- log(x)/x
- x^2+4*x-5
- x^3-4*x^2-24*x-12
You can create your owns of course.
You can download the spreadsheet template version is
here. The Macro allows
you to zoom in and zoom out of the function.