Avoid gap in chart in Excel
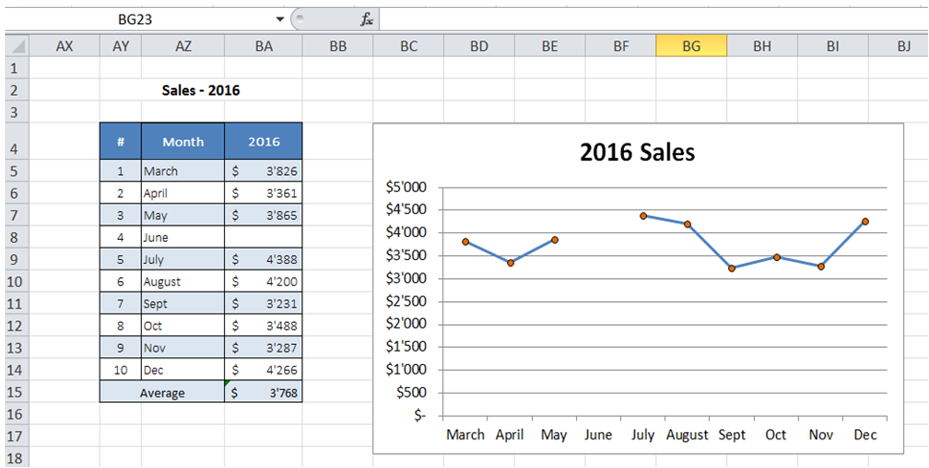
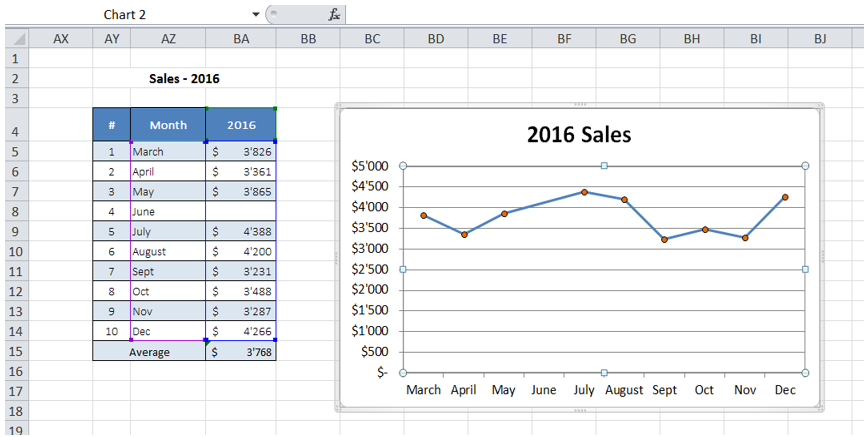
For example, in a range of monthly sales data, if a particular month's sales figure is missing, the line chart is discontinuous as shown below.
To do it in Excel, here is the answer:
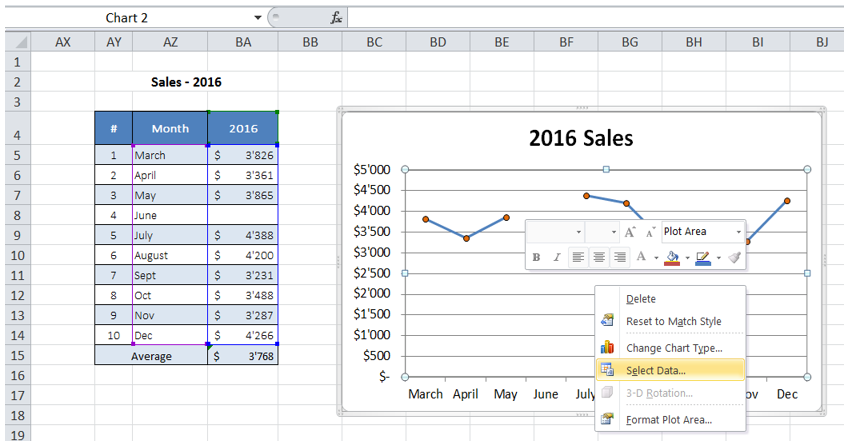
a) Right click on the chart area and then click "Select Data".
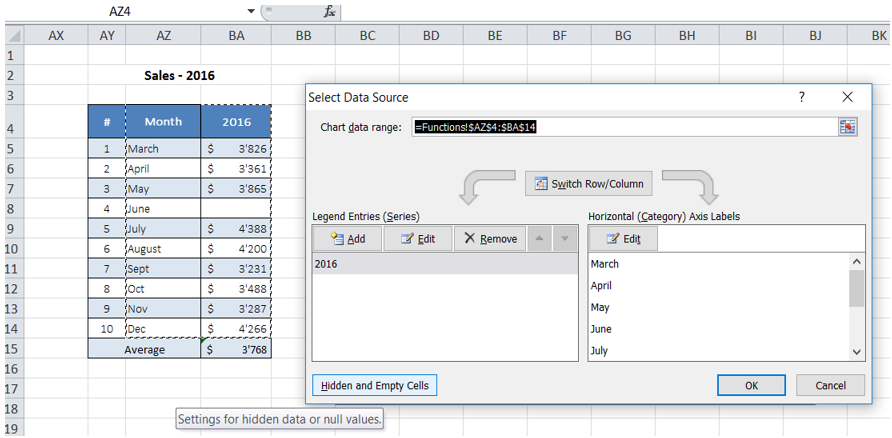
b) Click on "Hidden and Empty Cells"
c) Click on "Connect data points with line". Click OK -> OK.
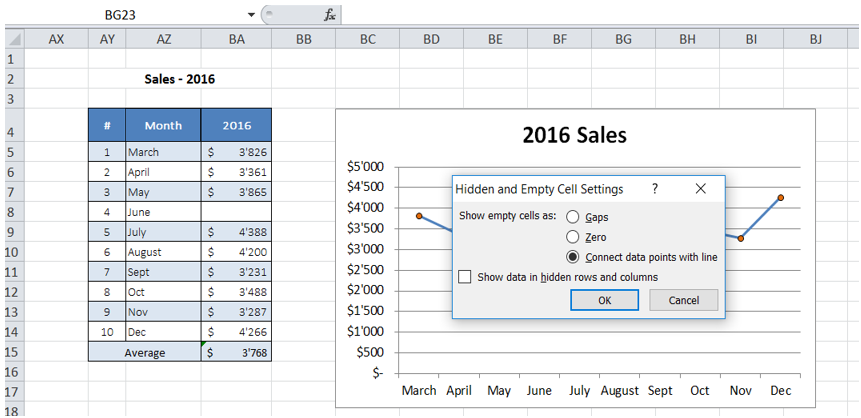
d) The missing data point is ignored and the chart line is continuous.
You can find similar Excel Questions and Answer hereunder
1) How can I access previously auto saved versions of my current Excel workbook?
2) How can I add and link a Chart Title to a cell value?
3) What are events in excel VBA. Here an explanation about VBA events.
4) How do I assign a macro to a shape using VBA?
5) Is there a way I can easily identify the duplicate values in a dataset?
6) How can I get the count of number of series in a Chart using VBA?
7) How do I restrict user entry in ActiveX Text Box to just numeric values?
8) I frequently use a Macro - is there a way to quickly access the Macro in the Excel Ribbon?
9) How can I export a chart as a gif file?
10) How can I add a legend to a chart using VBA?