Summarize raw data with sumproduct in Excel

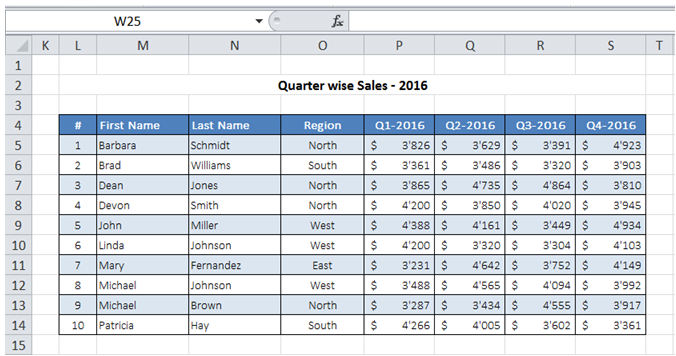
For example, I have my raw Sales Data information as shown below. In Excel, how can I get region wise Sales data?

excel summarize raw data with sumproduct

To do it in Excel, here is the answer:

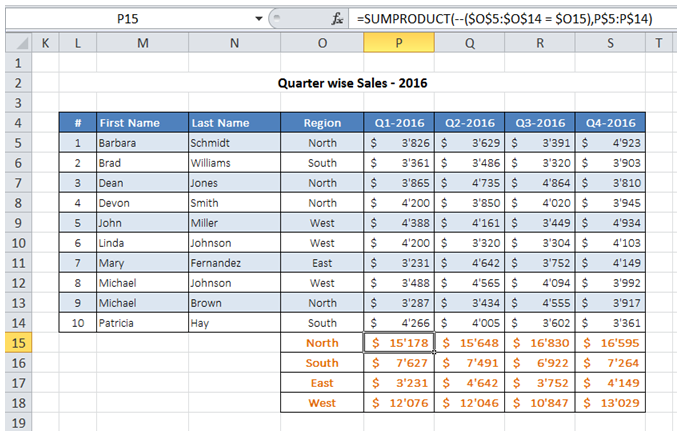
a) Enter the formula =SUMPRODUCT(--($O$5:$O$14 = $O15),P$5:P$14) to get Q1-2016 Sales data for North Region.

The first argument "($O$5:$O$14 = $O15)" looks for all values in range O5 : O14 that are same as value specified in cell O15. The "--" converts TRUE/FALSE to 1 or 0.

In the first argument, notice it is mentioned as $O15 so that the formula could be copied across rows.

The second argument picks and sums up the data if the first argument is TRUE for a value. Notice that the column reference P does not have a preceding $ so that the formula could be copied across columns.

Drag the formula to get Sales data for the rest of the quarters / regions as shown below.

excel summarize raw data with sumproduct


You can find similar Excel Questions and Answer hereunder

1) Tables in Excel VBA. How you can create table in VBA and work with them with macros

2) How can I set the Source Data of charts using VBA?

3) How can I identify all cells with Data Validation in my WorkSheet?

4) I have to retrieve data from a specific column in a Table. In Excel, how can I do that?

5) How can I plot 2 series on the same chart with different scales / measurement unit for Values (Ex: Pareto chart)?

6) How to import xml data into Excel using VBA

7) How to import data from Microsoft Access into Excel using VBA

8) How can I get row count of filtered data?

9) Is there a way to easily shade alternate rows in a data range for improving readability?

10) How can I enter information in multiple cells simultaneously?


Here the previous and next chapter