Confidence interval of population in Excel
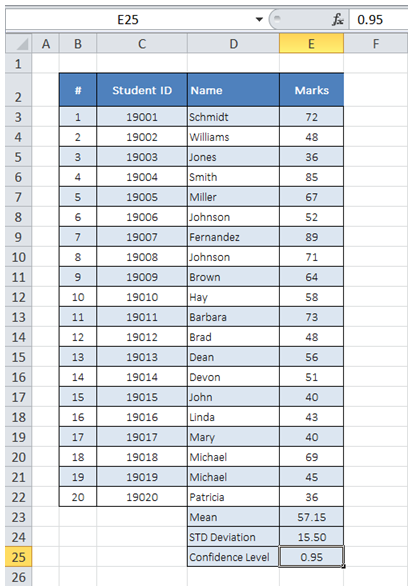
As shown in Table below, I have test results for my entire class captured. I have calculated Population Mean and Standard Deviation. I want to determine confidence interval for the calculated
Population Mean with a 95% confidence level.
To do it in Excel, here is the answer:
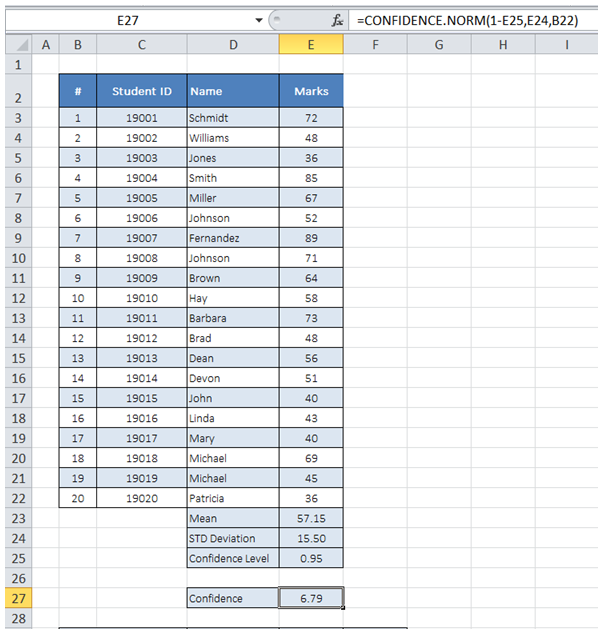
a) Enter the formula =CONFIDENCE.NORM(1-E25,E24,B22) as shown below to get the confidence value
The first argument is a which is "1-Confidence Level". Second argument is Standard Deviation and third argument is population size.
The ".NORM" in formula indicates interval is calculated using a Normal distribution.
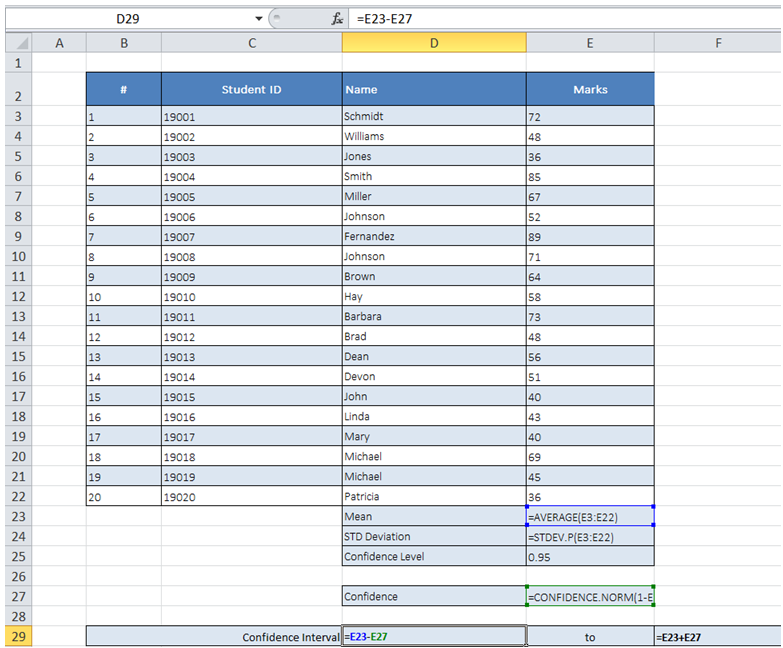
b) Subtract and add confidence value to mean to get the lower and upper limit of Confidence Interval as shown below.
You can find similar Excel Questions and Answer hereunder
1) How can I find time interval between 2 times?
2) How can I add interval to dates?
3) How to use goal seek in Excel. Some good introduction to goal seeking function
4) In Excel we use forms to interface with the user. Here some basics about GUI or graphical user interface
5) How to use flash fill in Excel. How to fill cells very quickly and automatically.
6) How do you close, save, open files and do other operations in the workbook in VBA
7) How can I get the most frequently occurring text in a range?
8) How do you close, save, open files and do other operations in the workbook in VBA
9) How can I turn off Alerts using VBA?
10) How can I calculate depreciation of assets using Excel?