Data table in Excel
The Data table is similar to the Scenario Manager and Goal Seek and does the same prediction function.
A data table is a range of cells in which you can change values in some of the cells and come up with different answers to a problem
There are two types of Data tables; One Variable data table and Two variable data table.
For illustration purpose, we will consider the One-variable data table.
One-variable data table is used while analyzing how different values of one variable in one or more formulas will change the results of those formulas.
The following example illustrates the use of Data table.
Let us build a data table that shows the monthly payments for loan terms ranging from 1 to 6 years.
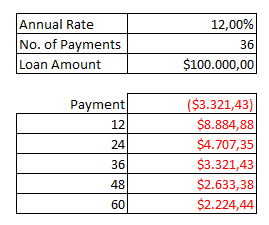
The Cells C10 to C12 contains the Loan details.
Insert PMT function in cell C14.
Now Select B14:C19.
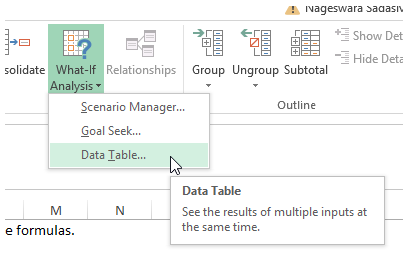
Goto "What-If" and Select Data Table as shown below:
The following window appears.
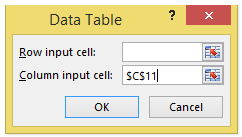
Select the Range B14:C19, that is to be used as Datatable.
Since we are to calculate payments based on various options of "No. of Payments", Select the corresponding cell C11 into the "Column Input Cell". And Click OK.
Now, the various values of Payments will be listed in the data table corresponding to No. of payments in col B15:B19.
This can also be achieved without the help of data table, but it involves a tedious task and is also prone to errors.
The Data table in turn, is simple and error free.