The Data Ribbon
The DATA ribbon is used mainly for the importation of data from outside Excel and all the filtering operation you can do with Excel. It is also used for grouping sets of data together so that the sheet becomes more lisible.
Here a quick overview.

The Get External Data is allows you to import data from outside Excel. Useful for advanced user. Another easy way to add external data is to Copy and Paste it with CTRL C and CTRL V.
The Connections is used to manage links that you would have with other spreadsheets or files. Because you can put links in your formula for example to another file. So the Connections area allows you to manage this.
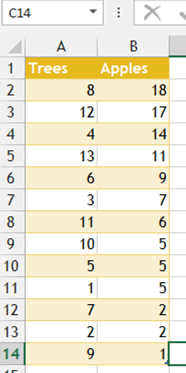
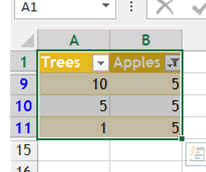
The Sort and Filter area is VERY useful and should be mastered. It allows you to do just what it says, sort and filter data and very efficiently. Exemple here where the table was sorted to show the tree that had the most apple first.
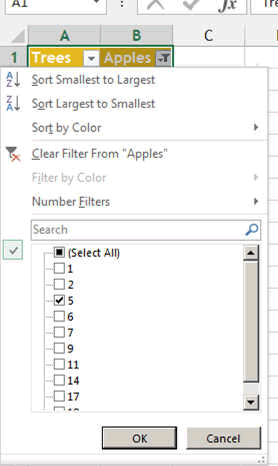
The Filtering function gives you the possibility to show only some specific data (like in the second image). You can select to see only the trees with 5 kgs of apple.
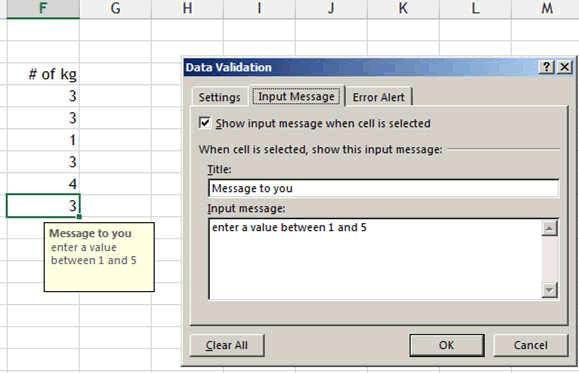
The Data Tool area allows you various function to
control the data entered. Here an exemple with data validation where we can
limit the data entered to be a number between 1 and 5.
Also data
consolidation and what if test are possible. For this look at the exemples
later in this presentation.
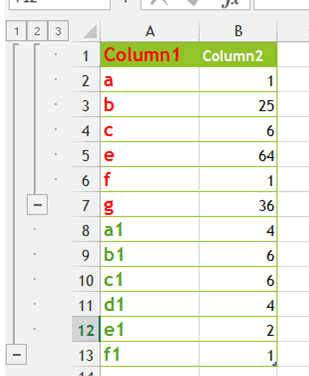
The Outline area allows to group rows or column in order to make the sheet look better or just hide stuff out to make it more lisible.
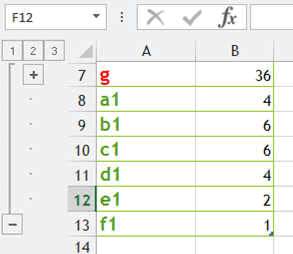
By selecting the columns and grouping them, you obtain the following groups. Then by pressing the little + or -, you make the group appear or disappear.